As you all know, the UNC System Strategic Plan set ambitious goals for student success–increases in graduation rates, degree efficiency, graduates in fields critical to North Carolina’s workforce, and completions by low-income and rural students. Degree completion is the culmination of a student’s path through college, and there are many milestones that students must meet along the way. As such, these metrics take time to show improvement. For instance, the effect of strategies designed to help first-year students navigate their first year on campus will not lead to improvements in graduation rates until four or five years later. The Annual Indicators Dashboard, now available, provides more timely data on critical milestones and interim measures of progress that can provide a fuller picture of institutional performance and improvement.
Each tab across the top of the dashboard corresponds to a leading indicator related to a strategic plan metric (or metrics).
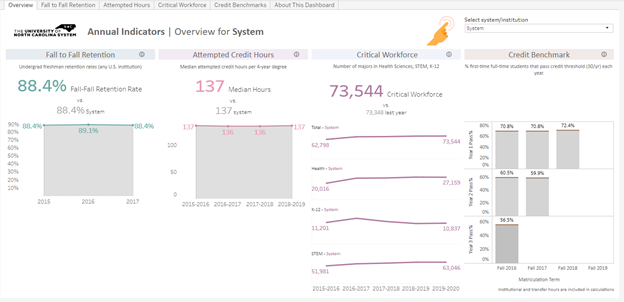
- Fall to Fall Retention is a measure we are all familiar with: the percentage of first-time, full-time bachelor’s degree-seeking fall cohort who are enrolled in the subsequent fall term, tracking closely with the five year graduation rate metric. Institutions can customize the metric to look at students that return for their second year, enroll in another UNC in year two, or wind up transferring to another accredited university in the U.S.
- Attempted Hours to Degree shows the median number of credit hours attempted for bachelor’s degree earners receiving their first bachelor’s degree in a given academic year, a measure of efficiency related to the number of undergraduate degrees produced per 100 undergraduate FTE (degree efficiency)..
- Critical Workforce provides the number of declared majors in the three Critical Workforce areas – STEM, Health Science, and Educator Preparation.
- Credit Benchmarks displays the number and percentage of undergraduates in the first-time full-time, bachelor’s degree-seeking fall cohort obtaining at least 30 credits by the start of sophomore year, at least 60 credits after their second year, and at least 90 credits after their third, which provides insight into the opportunities to improve timely graduation rates.
The main dashboard page shows a summary of all of these measures, and defaults to the System level. Institutions can filter by institution at the top (with additional filters on the left), and drill down into each individual indicator by selecting that tab. Hovering over parts of the chart provides additional information.
We hope these annual indicators will be useful as you continue to make progress in increasing student success.
![]()
You can subscribe directly to receive email notices about Insight and Did You Know. Past DYK newsletters are available on a blog here. If you have Insight access issues or dashboard content questions or concerns, please email insight@northcarolina.edu to open a ticket.